A Closer Look
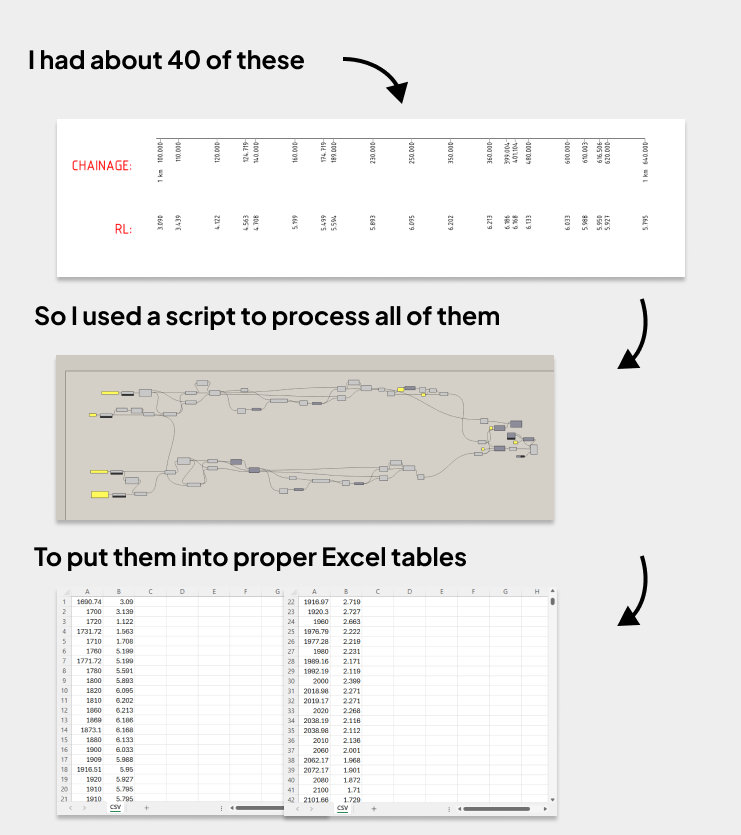
The client, a façade panel manufacturer was creating a new line of panels for their customers and they needed to create span tables for these new panels.
A span table is a table of the structural strength of all the possible profiles, thicknesses, lengths and perforation percentages (number of holes) of the panels. It’s something most manufacturers produce to help their customers decide which variation of the panel to order.
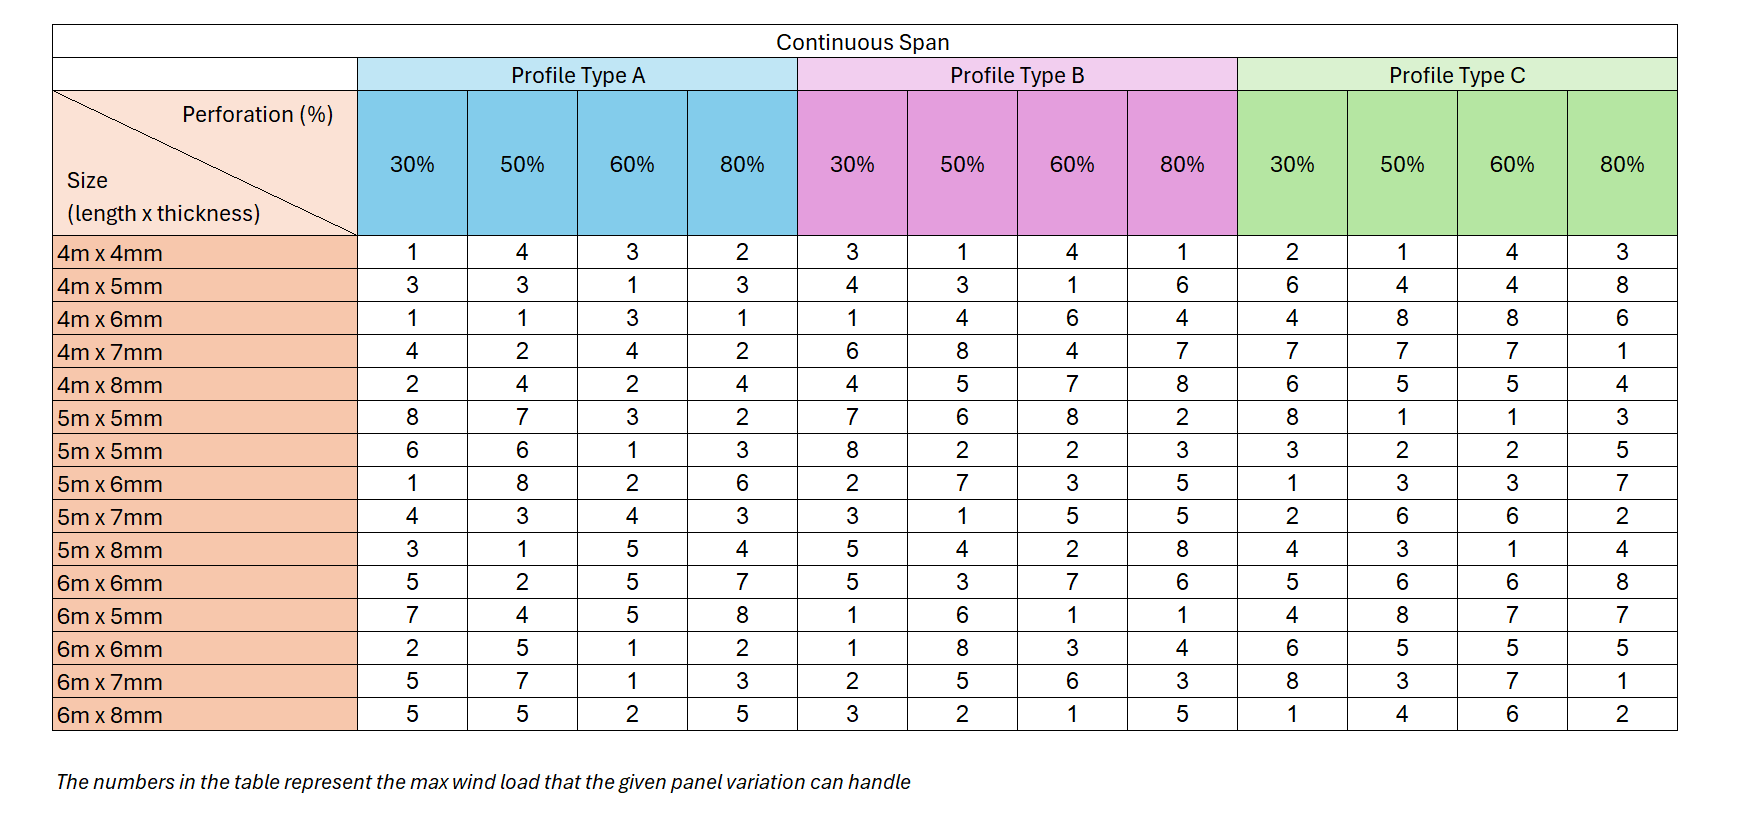
This was the span table the workflow created (numbers have been randomised)
In total, there were 6600 models of the different variations that needed to be modelled, analysesd and it’s results extracted. We tested different profile shapes. Different perforation percentages. Different support conditions, lengths, and thicknesses.
And it took ~132,000 minutes just for the solve, which is roughly the same amount of time it takes to watch the office 31 times. Not that I tried.
This was only made possible with the use of computational tools because handling and managing all that data manually would have been a nightmare.

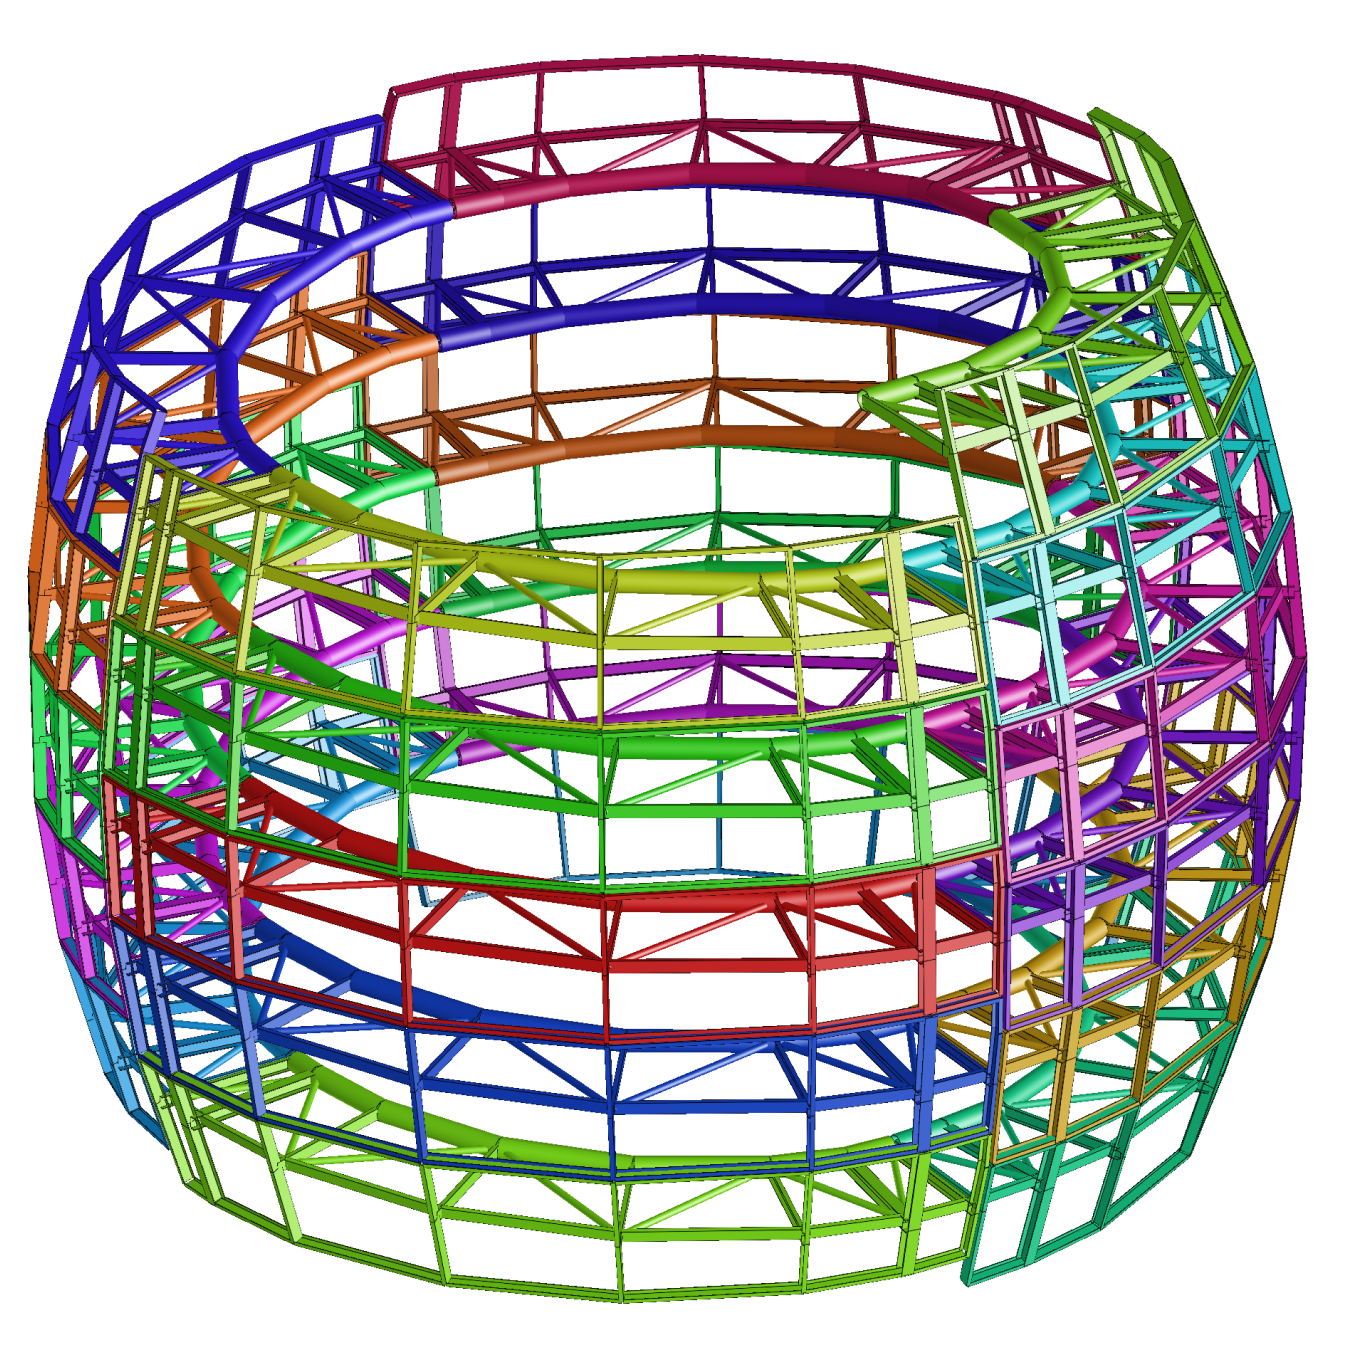
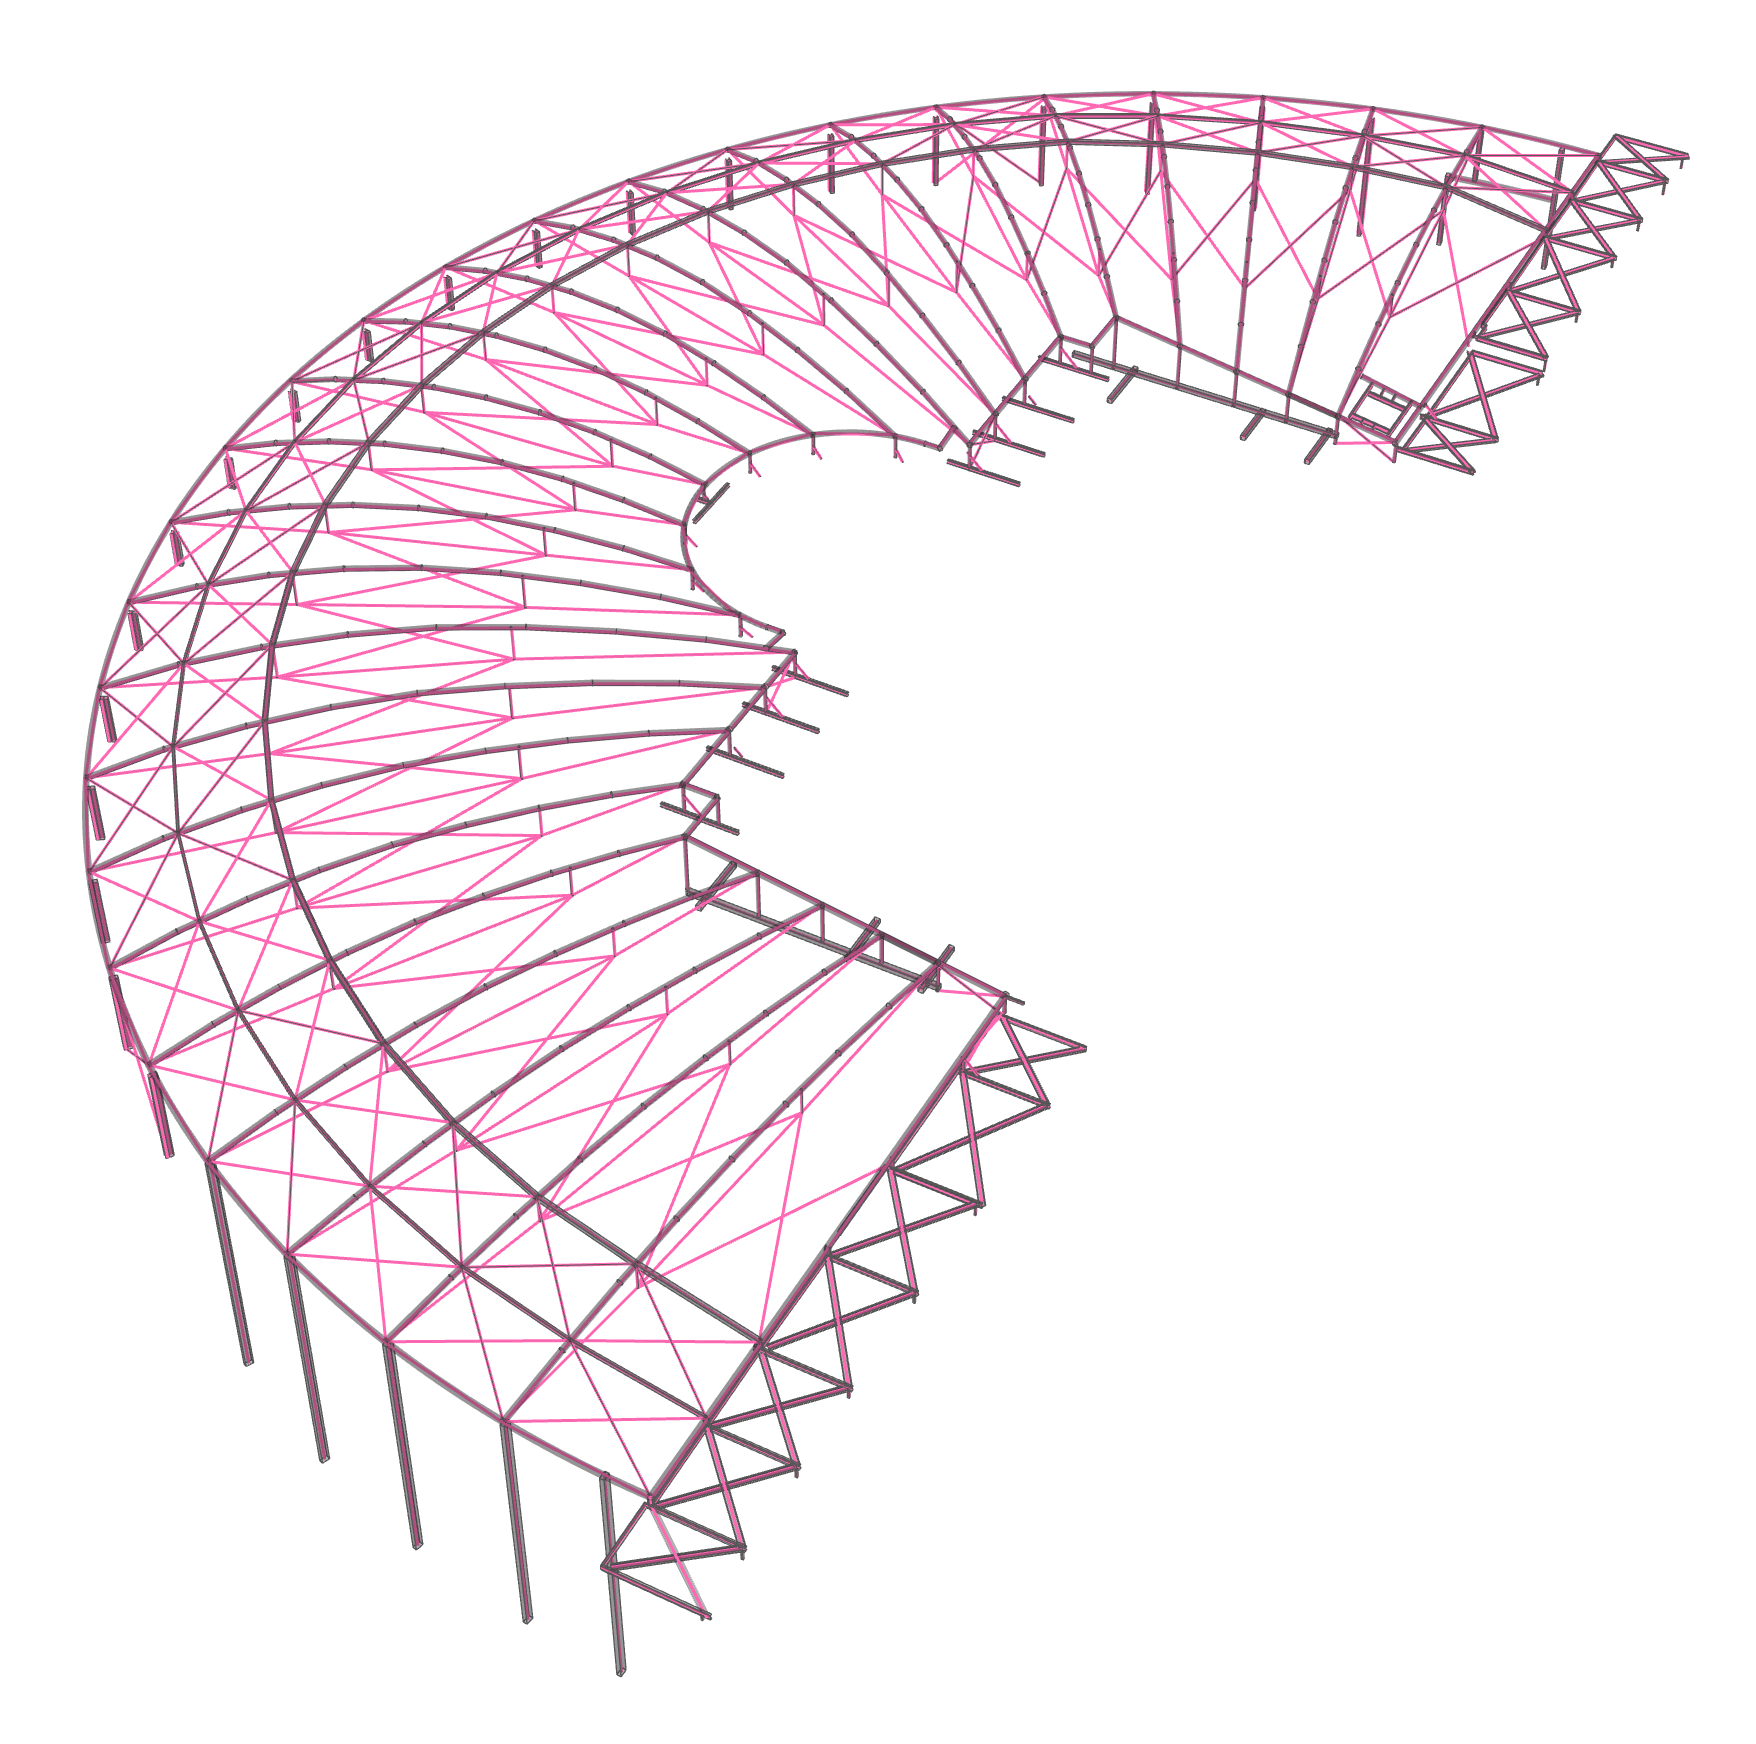
These were all the different panel profiles we had to analyse