A Closer Look
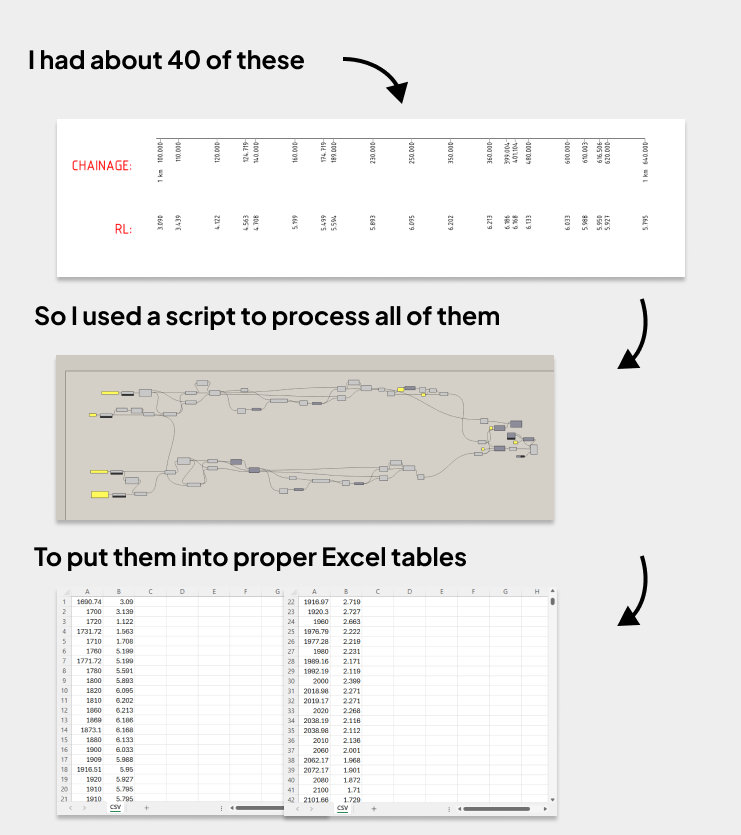
We had about 40–80 tables showing elevations and curvature at each chainage along a track. But instead of being in Excel, they came in DWG format (lines and text). Apparently, according to the client, is was the only way their software could export the data (which I still don’t quite believe).
But now we had all this important data locked inside a format that was painful to work with.
Copying it out manually would’ve taken days and probably introduced all sorts of errors. The good news was that the tables were fairly consistent across files. Still annoying to work with but not impossible to write a script to extract them.
And that’s what I did. I built a quick Grasshopper script that scanned the table geometry, pulled out the text, and exported clean everything into clean Excel sheets.
It wasn’t the most complex script I’ve written, but it made a huge difference on this project. What would’ve been a few days of mindless copy-pasting turned into a couple of hours of setup. And we got lucky.
The tables ended up changing about 5-10 times over the course of the project. Something we didn’t plan for. But with the script in place, every time a new set of tables came in, I just re-ran it and had clean Excel files ready almost instantly.
This is one of those times where computational design is really good at just taking the pain out of a really tedious task. Even if, honestly, it shouldn’t have been a problem in the first place.