Visualising Data in 3D

Visualising Data in 3D

Type: Quick
Benefits:
Saved Time Increased Clarity

A quick script that colour codes any property of a model in 3D

A Closer Look

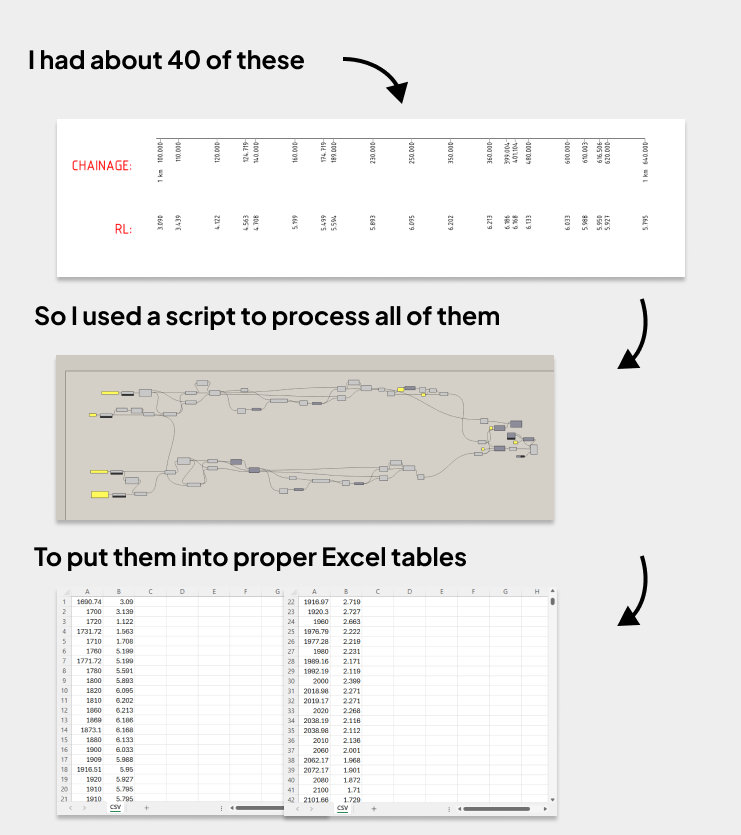
The Problem: Most of the data behind 3D models are hidden behind schedules and lists. It makes it hard to see any useful patterns in the data
The Approach: A script that takes any 3D model and allows anyone to colour code and visualise a property
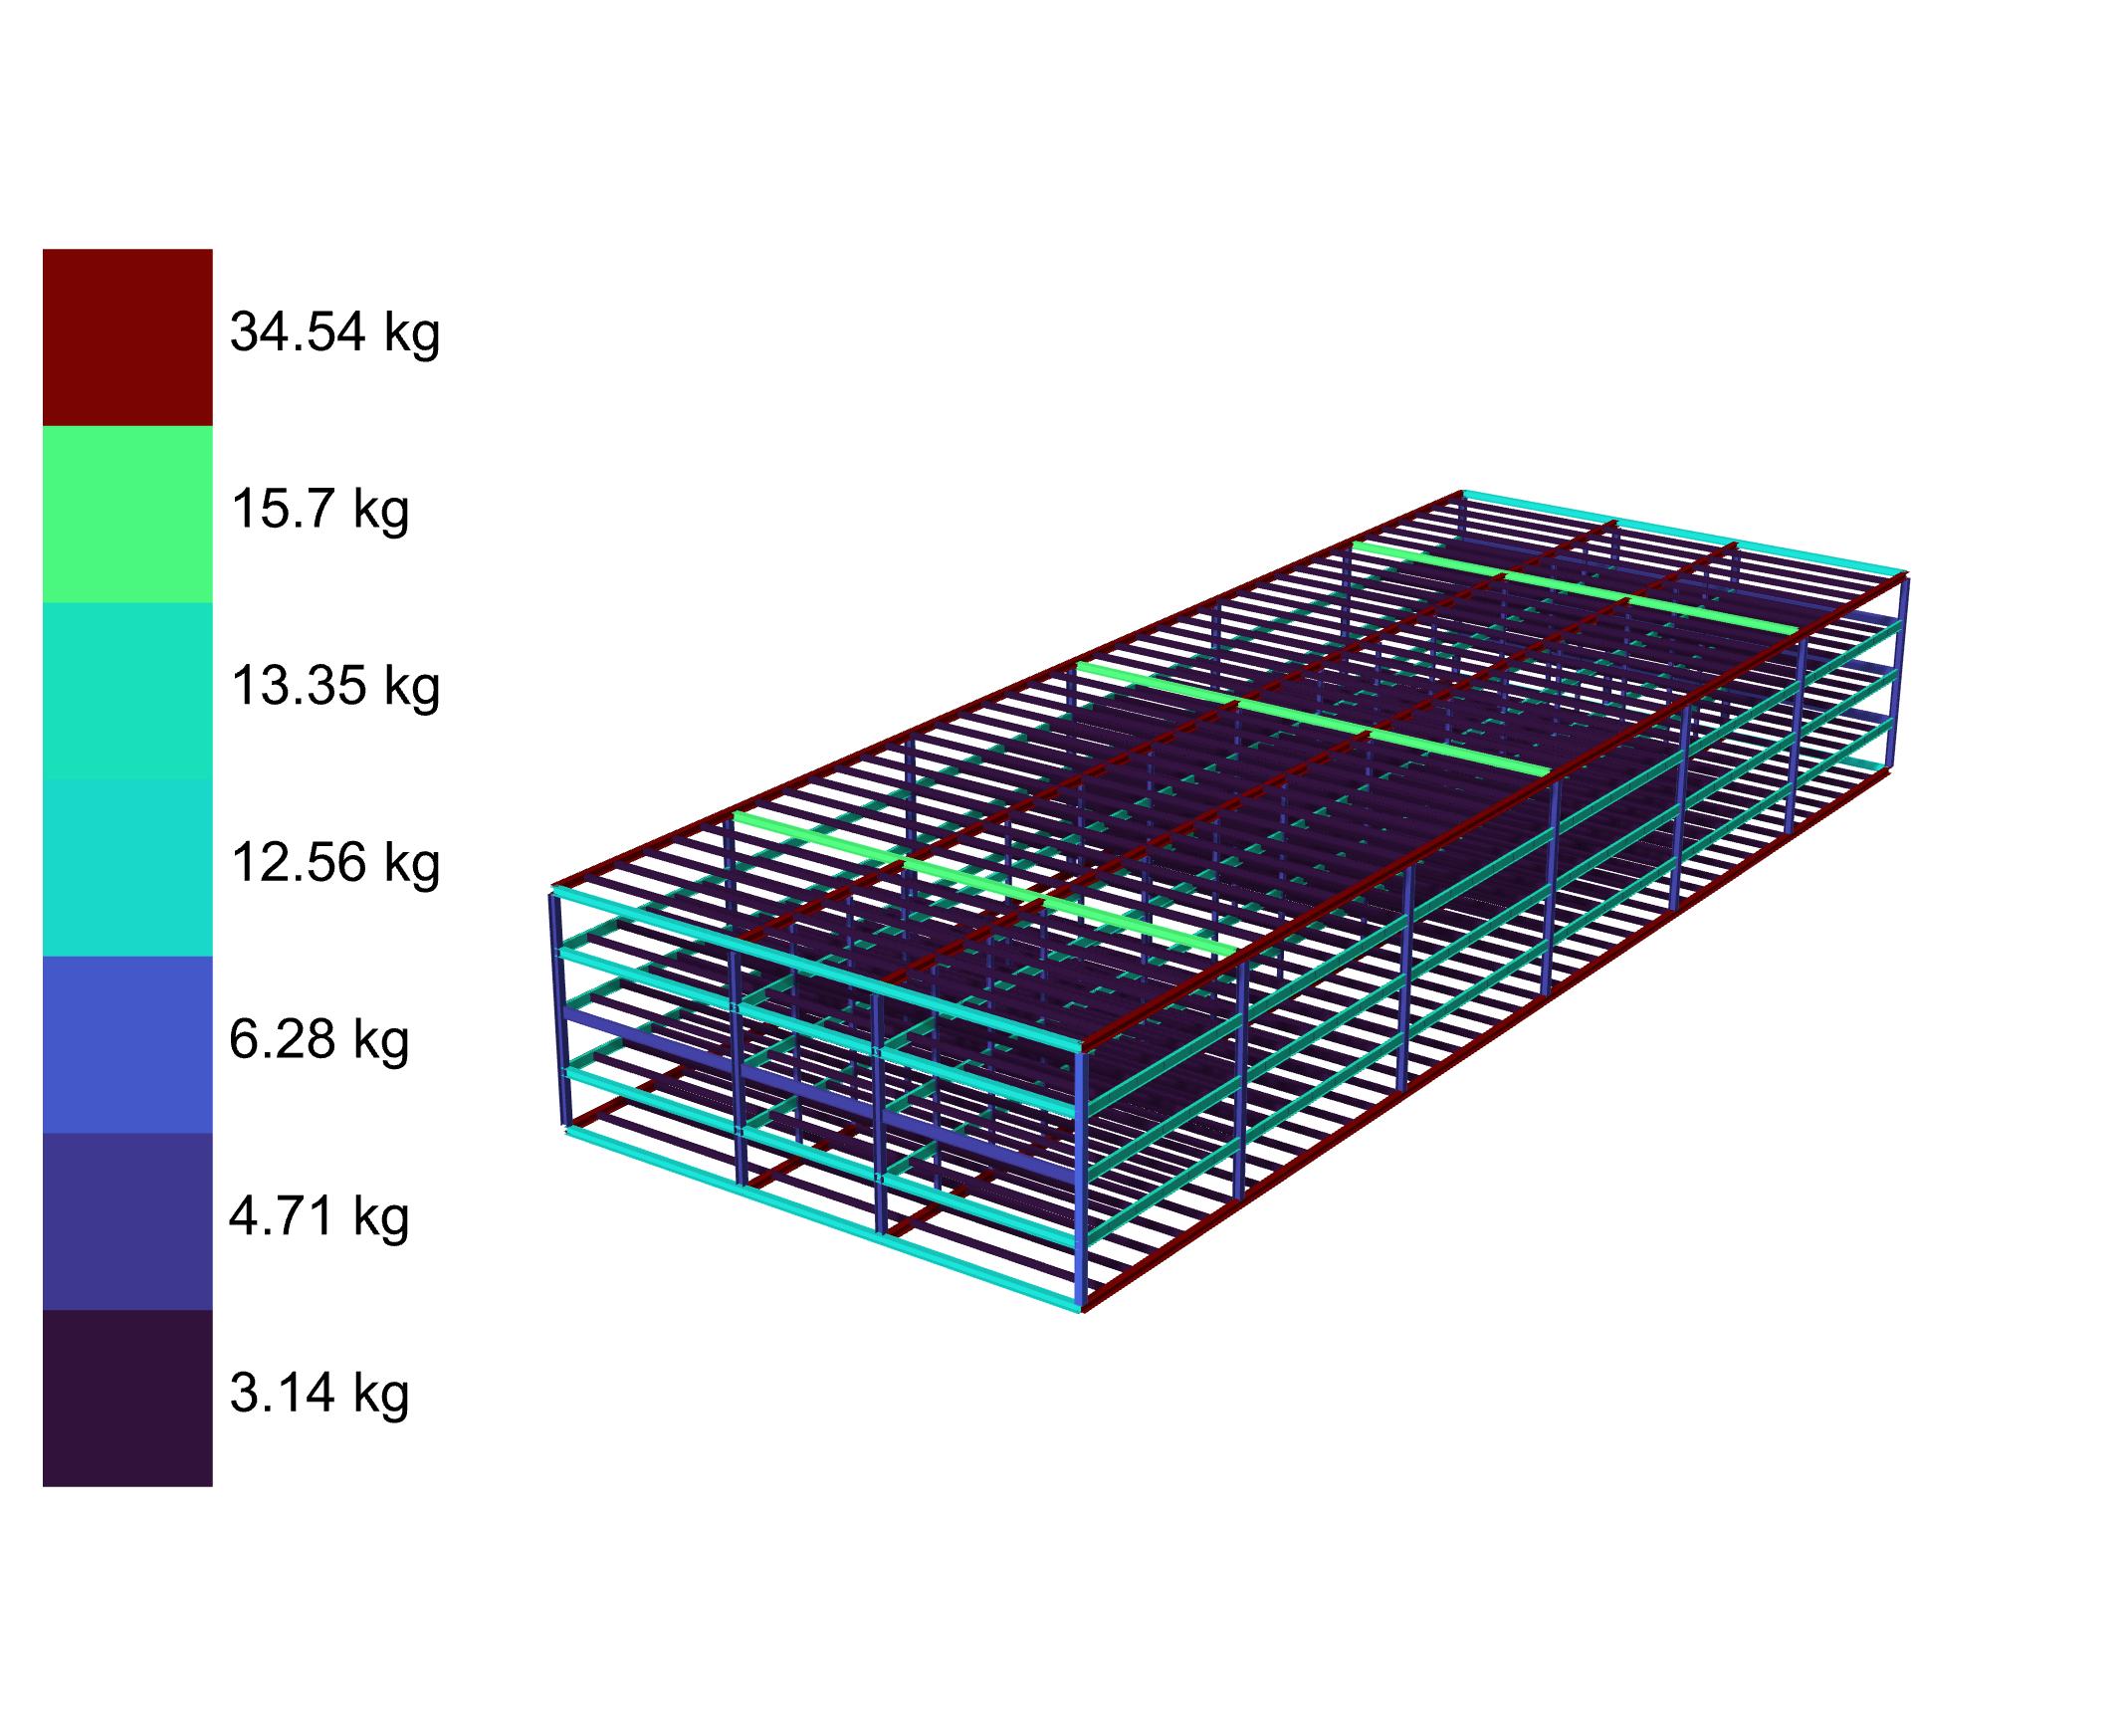
The Outcome: A clear and visual way to digest the data. Especially useful for reports and communicating the data

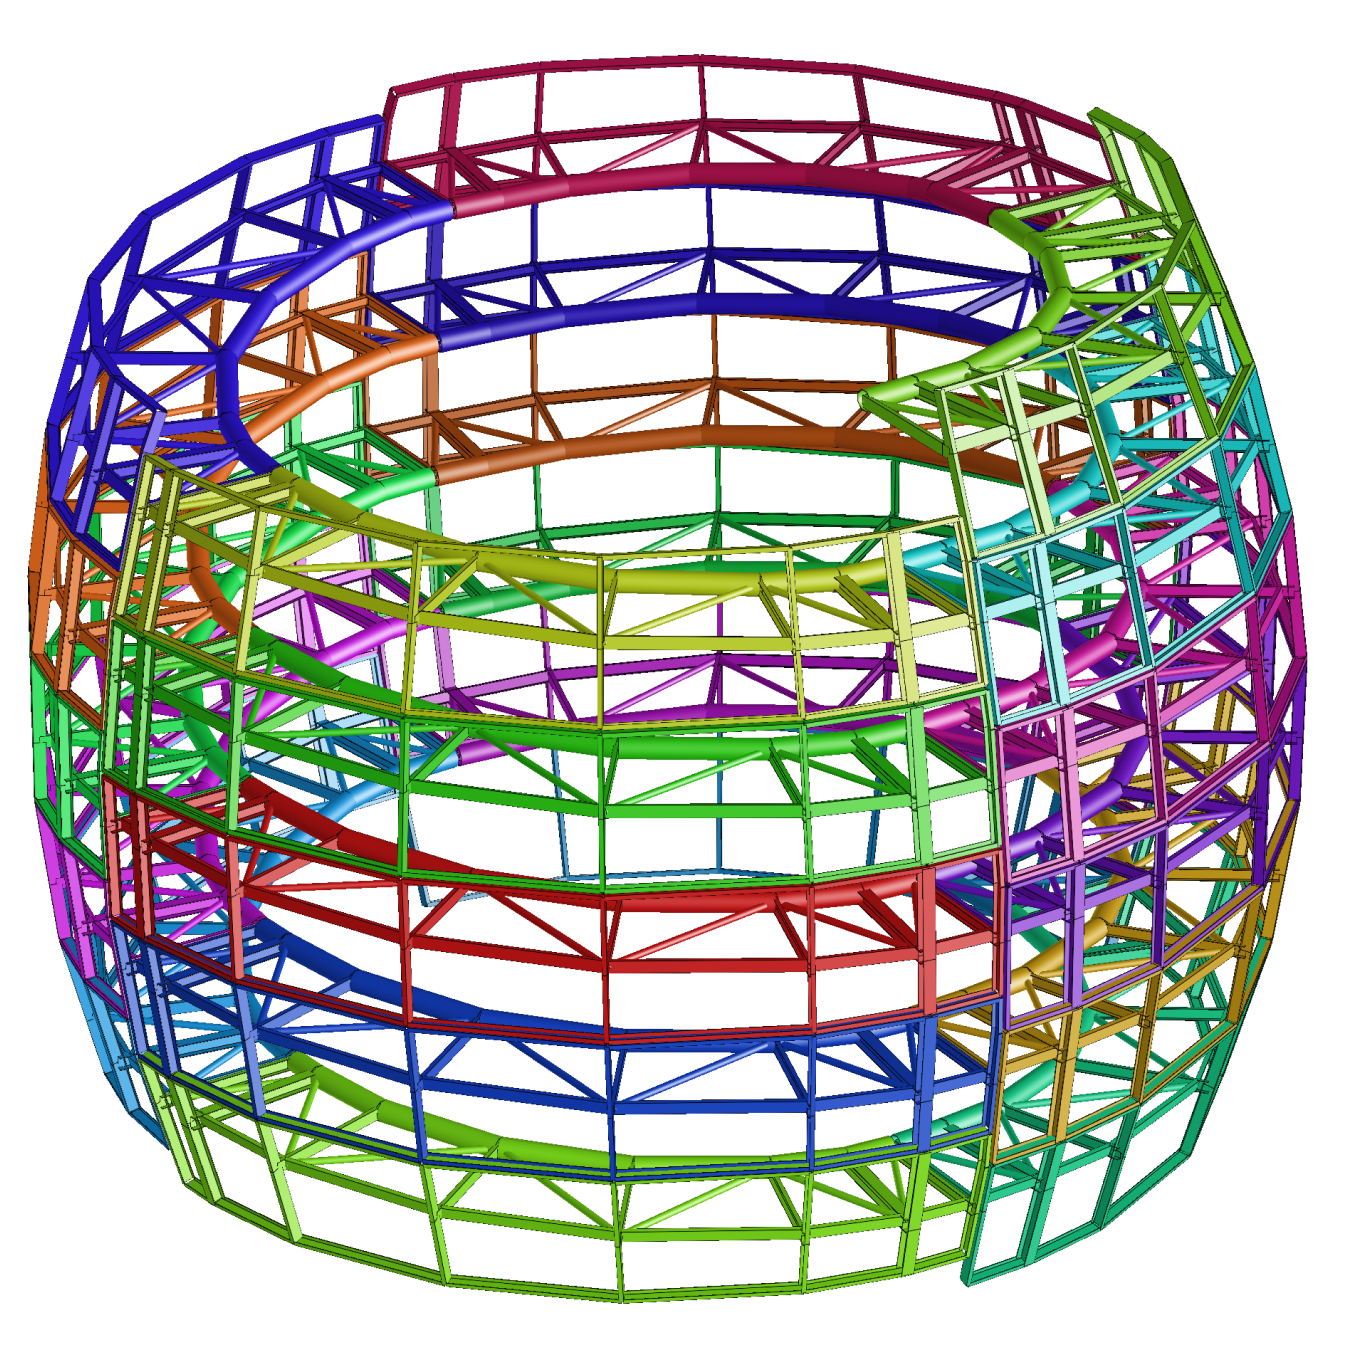
3D models have a lot of data hidden in them. The only real way to access them is through schedules or tables. Which is nice but it’s still hard to make sense of the data. This is especially true if you’re trying to get some overall information from models.

So instead of uploading a model into an external program to visualize these properties, I wrote a script in Grasshopper that does this. And because I have a system setup in Grasshopper, whipping up a script like this takes almost no time.

Recent Projects

Extracting Tables From Drawings

Extracting Tables From Drawings

Quick Time Saver

A couple of hours of scripting turned 40+ DWG tables into clean Excel sheets. Saving days of manually filling it out and reducing the chance of errors.

Extracting Center lines From models

Extracting Center lines From models

Quick Time Saver

A script that extracts structural analysis centerlines from 3D models, saving engineers from re-building the model from scratch

Extract Midplanes and Thicknesses from Complex 3D Models

Extract Midplanes and Thicknesses from Complex 3D Models

Quick Clarity Efficiency

A script that extracts midplanes (surfaces at the center of solids) from a 3D model and color-codes them by thickness.