Visualizing Reinforcement Bar Tonnage

Visualizing Reinforcement Bar Tonnage

Type: Systemic
Benefits:
Clarity Efficiency

A tool that visualizes reinforcement bars from a Revit model, making it easier for engineers to review bar layouts and get quick quantity takeoffs.

A Closer Look

The Problem: Engineers design reinforcement intent, but the actual bars are handled by drafters. That disconnect makes it hard to get accurate quantities without manually measuring and counting from the drawing.
The Approach: A tool that reads reinforcement data from Revit, pulls relevant data together and displays it interactively. Giving engineers full transparency into what's been drafted.
The Outcome: Clearer visibility into what’s been drawn, faster quantity checks, and better decisions around tonnage and over-design.

Documenting reinforcement bars (REO) is a tricky problem to solve. And a hotly debated one.

That’s because it touches on everything. People start talking about REO drafting standards or trying to get engineers and drafters to talk more. Everyone has an opinion on how REO should be designed, drawn, and documented for accurate quantities.

The tool I built doesn’t try to solve all of that. It’s really not here to settle the debate. But it does aim to bring more clarity to the process.

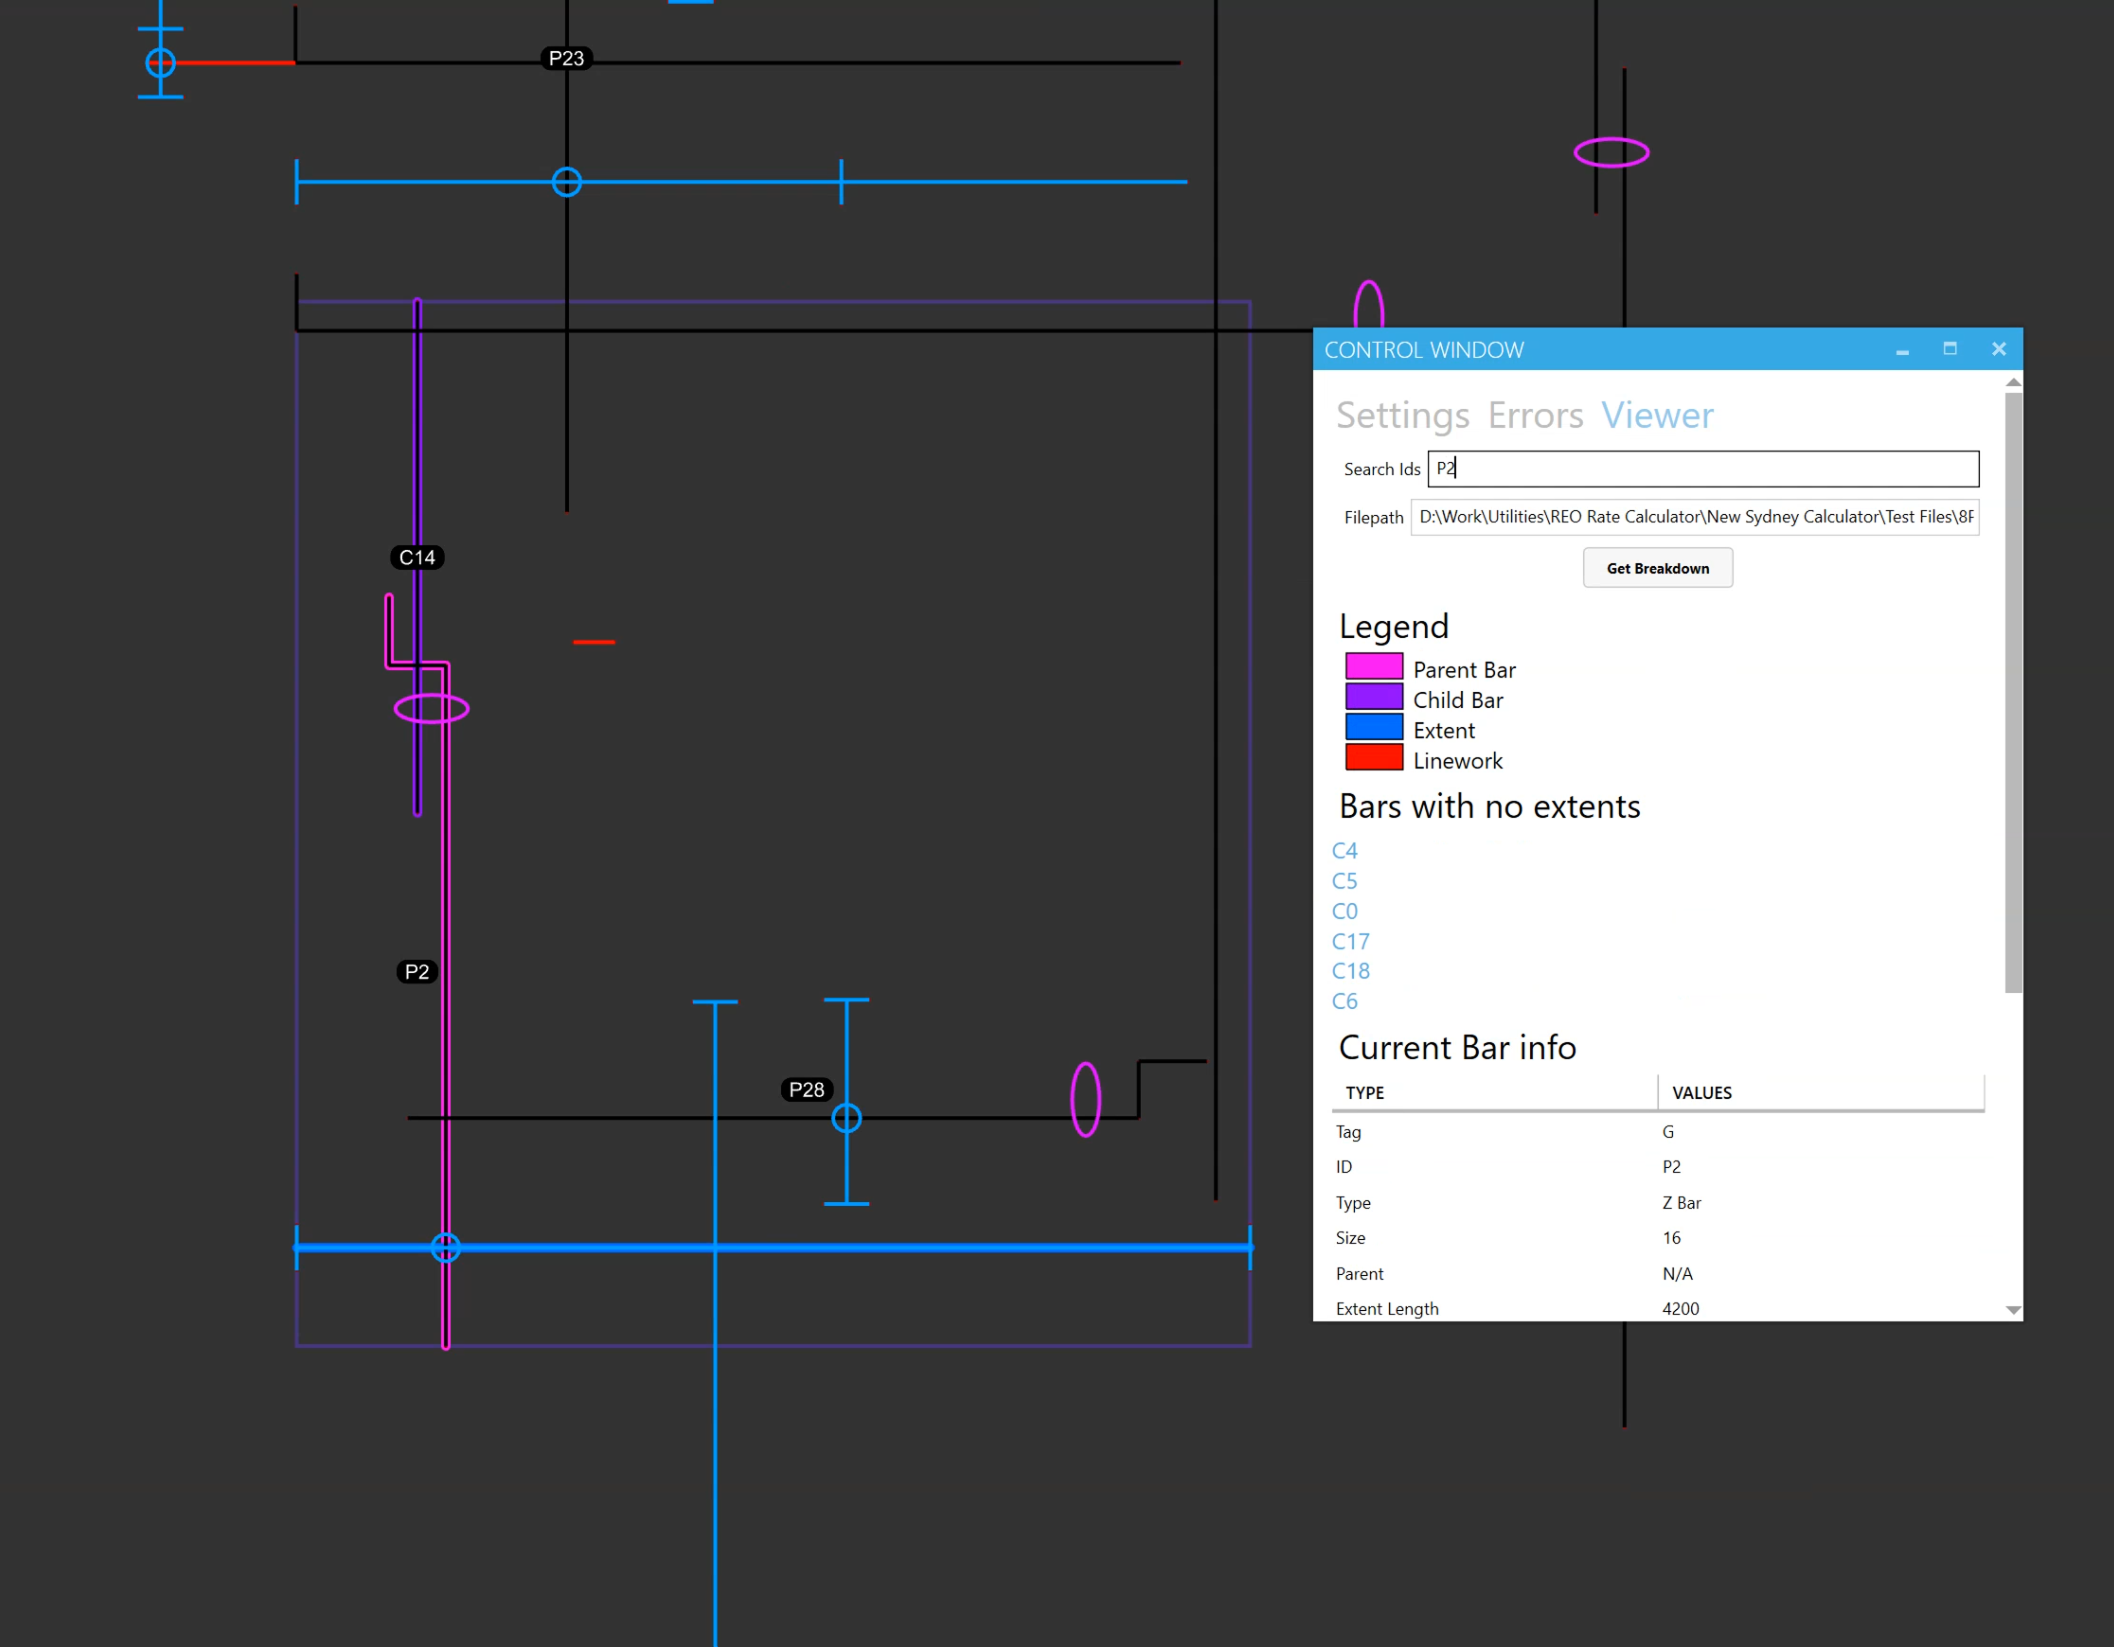
It reads the Revit model and extracts all the drafted reinforcement, then presents that data in a format that’s easy for engineers to review. You get a visual report of the bars on each floor, with every bar assigned a unique ID. Engineers can search by ID, jump directly to that bar on the floor, and view all the relevant properties and metadata.

Then when needed, they can also export a complete breakdown showing tonnage, bar types, and quantities. Including the bars that the tool could not calculate, so that they can manually enter those in.

While it doesn’t solve how REO should be designed or documented, it does make what’s actually been drafted visible, searchable, and understandable. It helps engineers make more informed decisions, reduce unnecessary reinforcement, and respond to client requests much faster.

It brings clarity to an otherwise cloudy process.

Recent Projects

Extracting Tables From Drawings

Extracting Tables From Drawings

Quick Time Saver

A couple of hours of scripting turned 40+ DWG tables into clean Excel sheets. Saving days of manually filling it out and reducing the chance of errors.

Extracting Center lines From models

Extracting Center lines From models

Quick Time Saver

A script that extracts structural analysis centerlines from 3D models, saving engineers from re-building the model from scratch

Visualising Data in 3D

Visualising Data in 3D

Quick Saved Time Increased Clarity

A quick script that colour codes any property of a model in 3D